Lab / Car Performance
Optimal Upshift RPM
Finding optimal upshift pattern through theory and measurement
| - | Miles per hour (mph) notations for vehicle speed have been added. |
Summary
An optimal upshift RPM of some cars may be lower or higher than an engine redline RPM. This report aims to find an upshift RPM pattern for the fastest acceleration through theory and measurement.
First of all, a calculation result of theoretical upshift RPMs (Table 1) and a measurement result of vehicle speeds and time gaps (Fig. 1) on GT Sport are shown. A test car was GR Supra Gr.3. In this report, the theoretical upshift RPM was calculated from an intersection of tractive force curves. The tractive force curves and a calculation method will be described later in the following section. A method of measuring the vehicle speeds and time gaps will also be explained later.
| Table 1 | Theoretical Optimal Upshift RPMs and Measured Vehicle Speeds at Upshift |
| Upshift | Optimal RPM (Theoretical) [rpm] |
Vehicle Speed (Measured) [km/h (mph)] |
|---|---|---|
| 1st → 2nd | 7500 | 100 ± 1 (62 ± 1) |
| 2nd → 3rd | 7200 | 131 ± 1 (81 ± 1) |
| 3rd → 4th | 7100 | 161 ± 1 (100 ± 1) |
| 4th → 5th | 7100 | 193 ± 1 (120 ± 1) |
| 5th → 6th | 7100 | 233 ± 1 (145 ± 1) |
| Fig. 1 | Measured Vehicle Speeds and Time Gaps between Optimal Upshift and Redline Upshift(Each is an average of 5 trials.) |
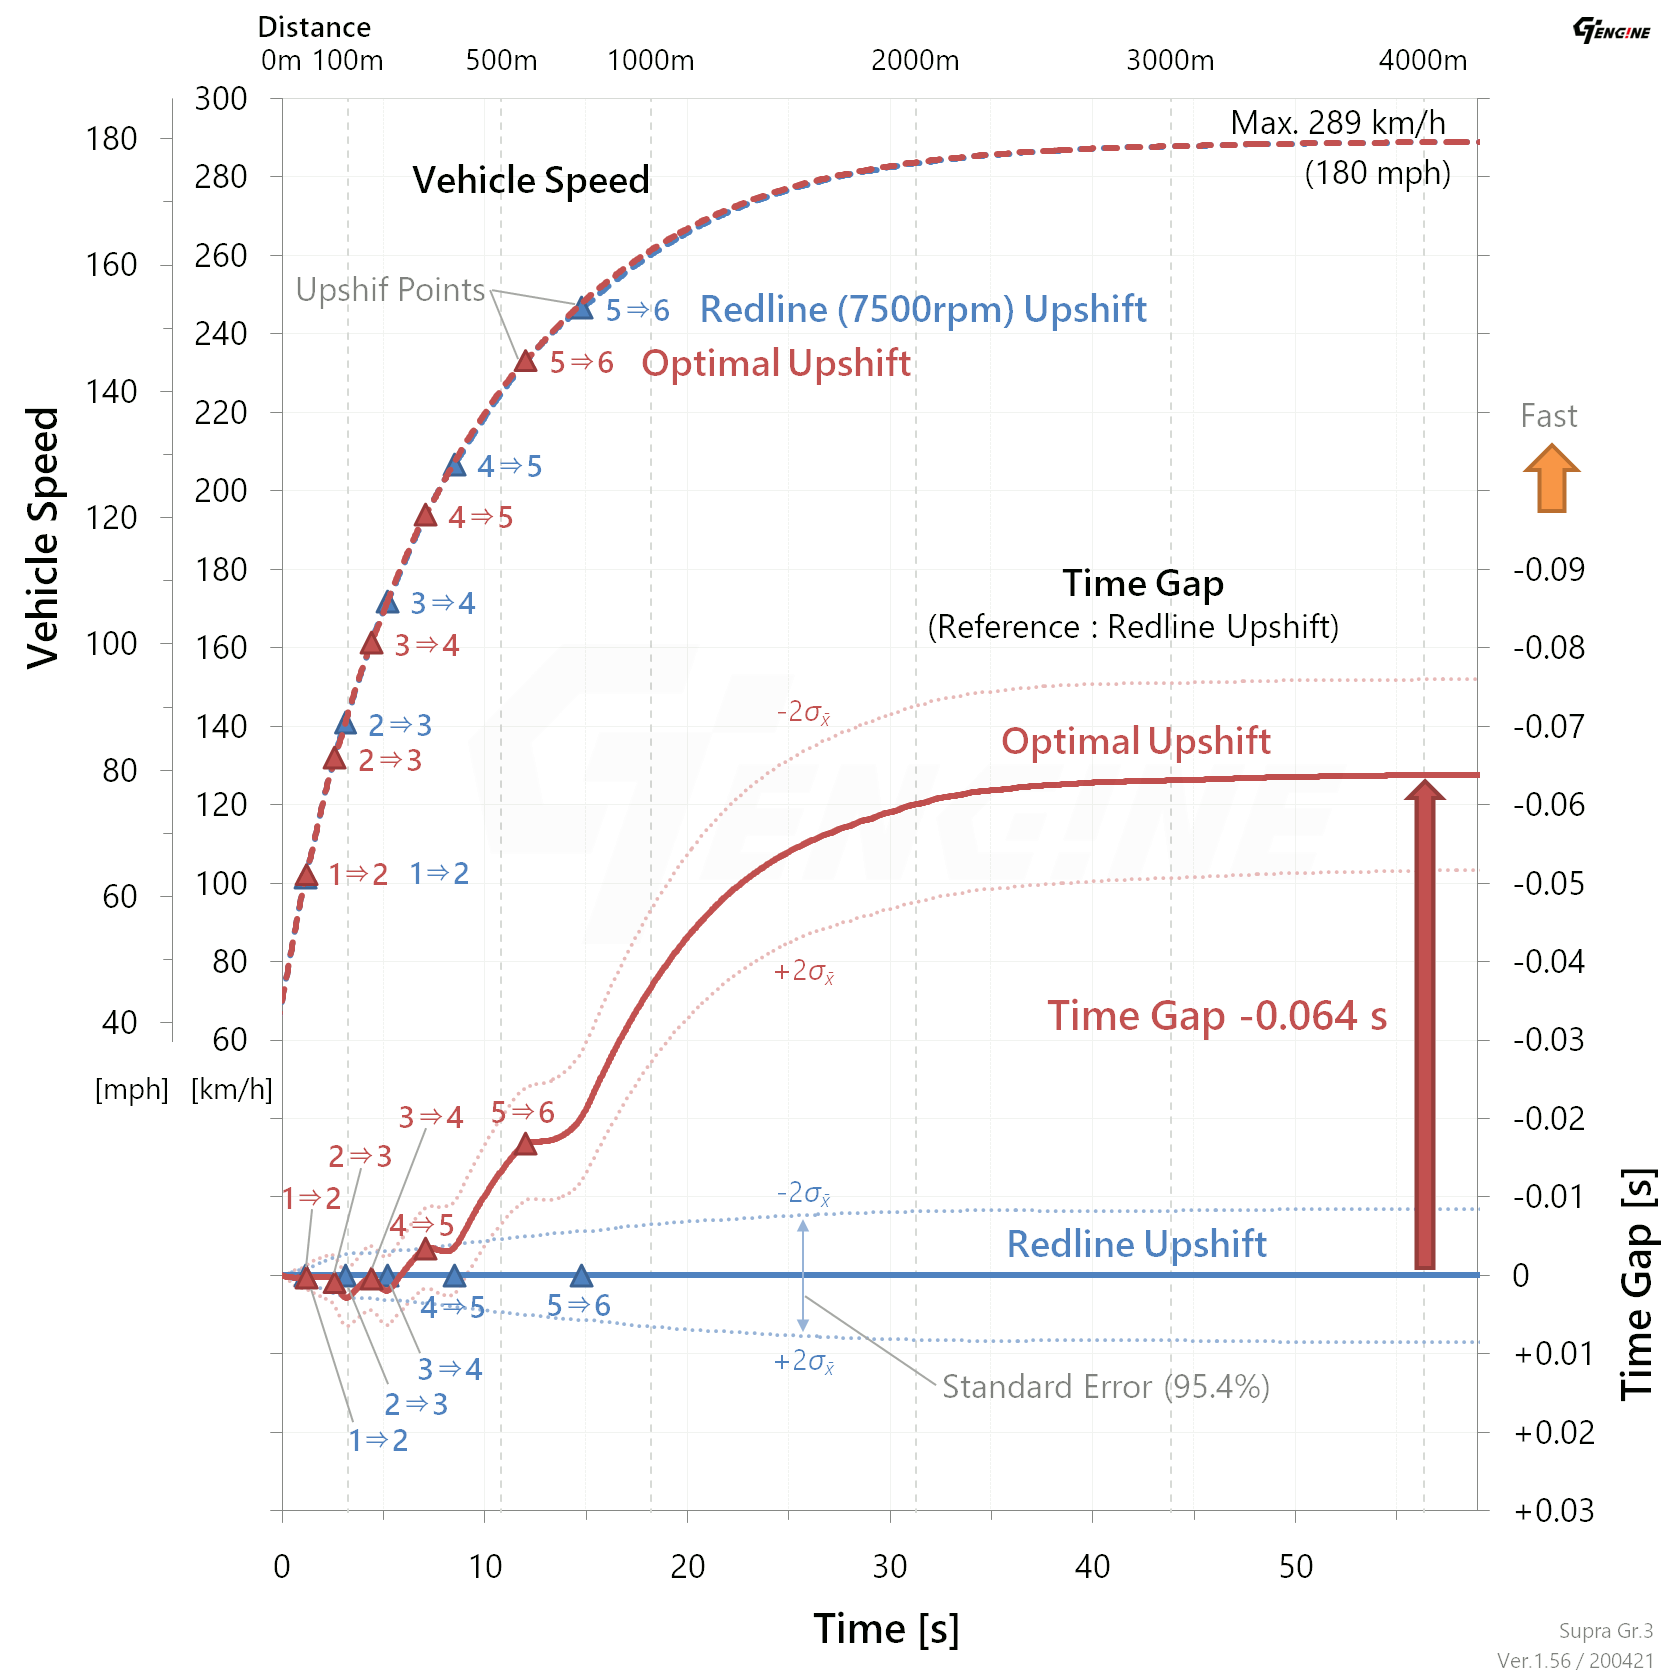
As shown in Table 1, except for the 1st to 2nd upshift, the calculated optimal RPMs are lower than the redline 7500 rpm. Fig. 1 shows measured vehicle speeds and time gaps between the optimal upshift pattern and redline upshift pattern. The optimal upshift pattern has a gain of about 0.06 seconds at the maximum speed compared to the redline one. It was confirmed that this optimal upshift pattern was effective under conditions of this test.
Incidentally, this optimal RPM pattern has room for improvement. I will not go into details about that this time. However, some other test results suggest that it is better to upshift at 100-200 higher RPM for gears above 3rd. The reason seems to be that the method used this time is static. A more accurate calculation requires transitional factors. In the future, I would like to update these optimal RPMs with more detailed theoretical models and additional tests.
Theoretical Upshift RPM
In this report, the theoretical optimal upshift RPM was calculated from the intersection of two tractive force (traction) curves of adjacent gears. This method is simple and well known.
For each gear, the tractive force at drive wheels $ F $ and the vehicle speed $ v $ are calculated from Eq. 1 and Eq. 2.
where:
| $ T_e $ | [Nm] | : | Engine torque |
| $ N_e $ | [rpm] | : | Engine RPM |
| $ i_n $ | [-] | : | $ n $ th Gear ratio |
| $ i_f $ | [-] | : | Final drive ratio |
| $ \eta_d $ | [-] | : | Drivetrain efficiency |
| $ r_t $ | [m] | : | Tyre radius |
In this case, to simplify the calculation, drivetrain efficiency $ \eta_d $ was 1, a tyre radius $ r_t $ was a static and unloaded tyre radius. Moreover, tyre slips were also ignored. Therefore, note that the calculated vehicle speeds are up to about 15% larger than the measurement values.
Fig. 2 shows the tractive force curves of each gear and the RPMs at their intersections. Power curves are also shown in Fig. 2 for reference. Specifications of the test car are shown at the end of this section. (Table 2, 3 and Fig. 3)
| Fig. 2 | Tractive Force, RPM and Power versus Vehicle Speed of GR Supra Gr.3 (BoP) |
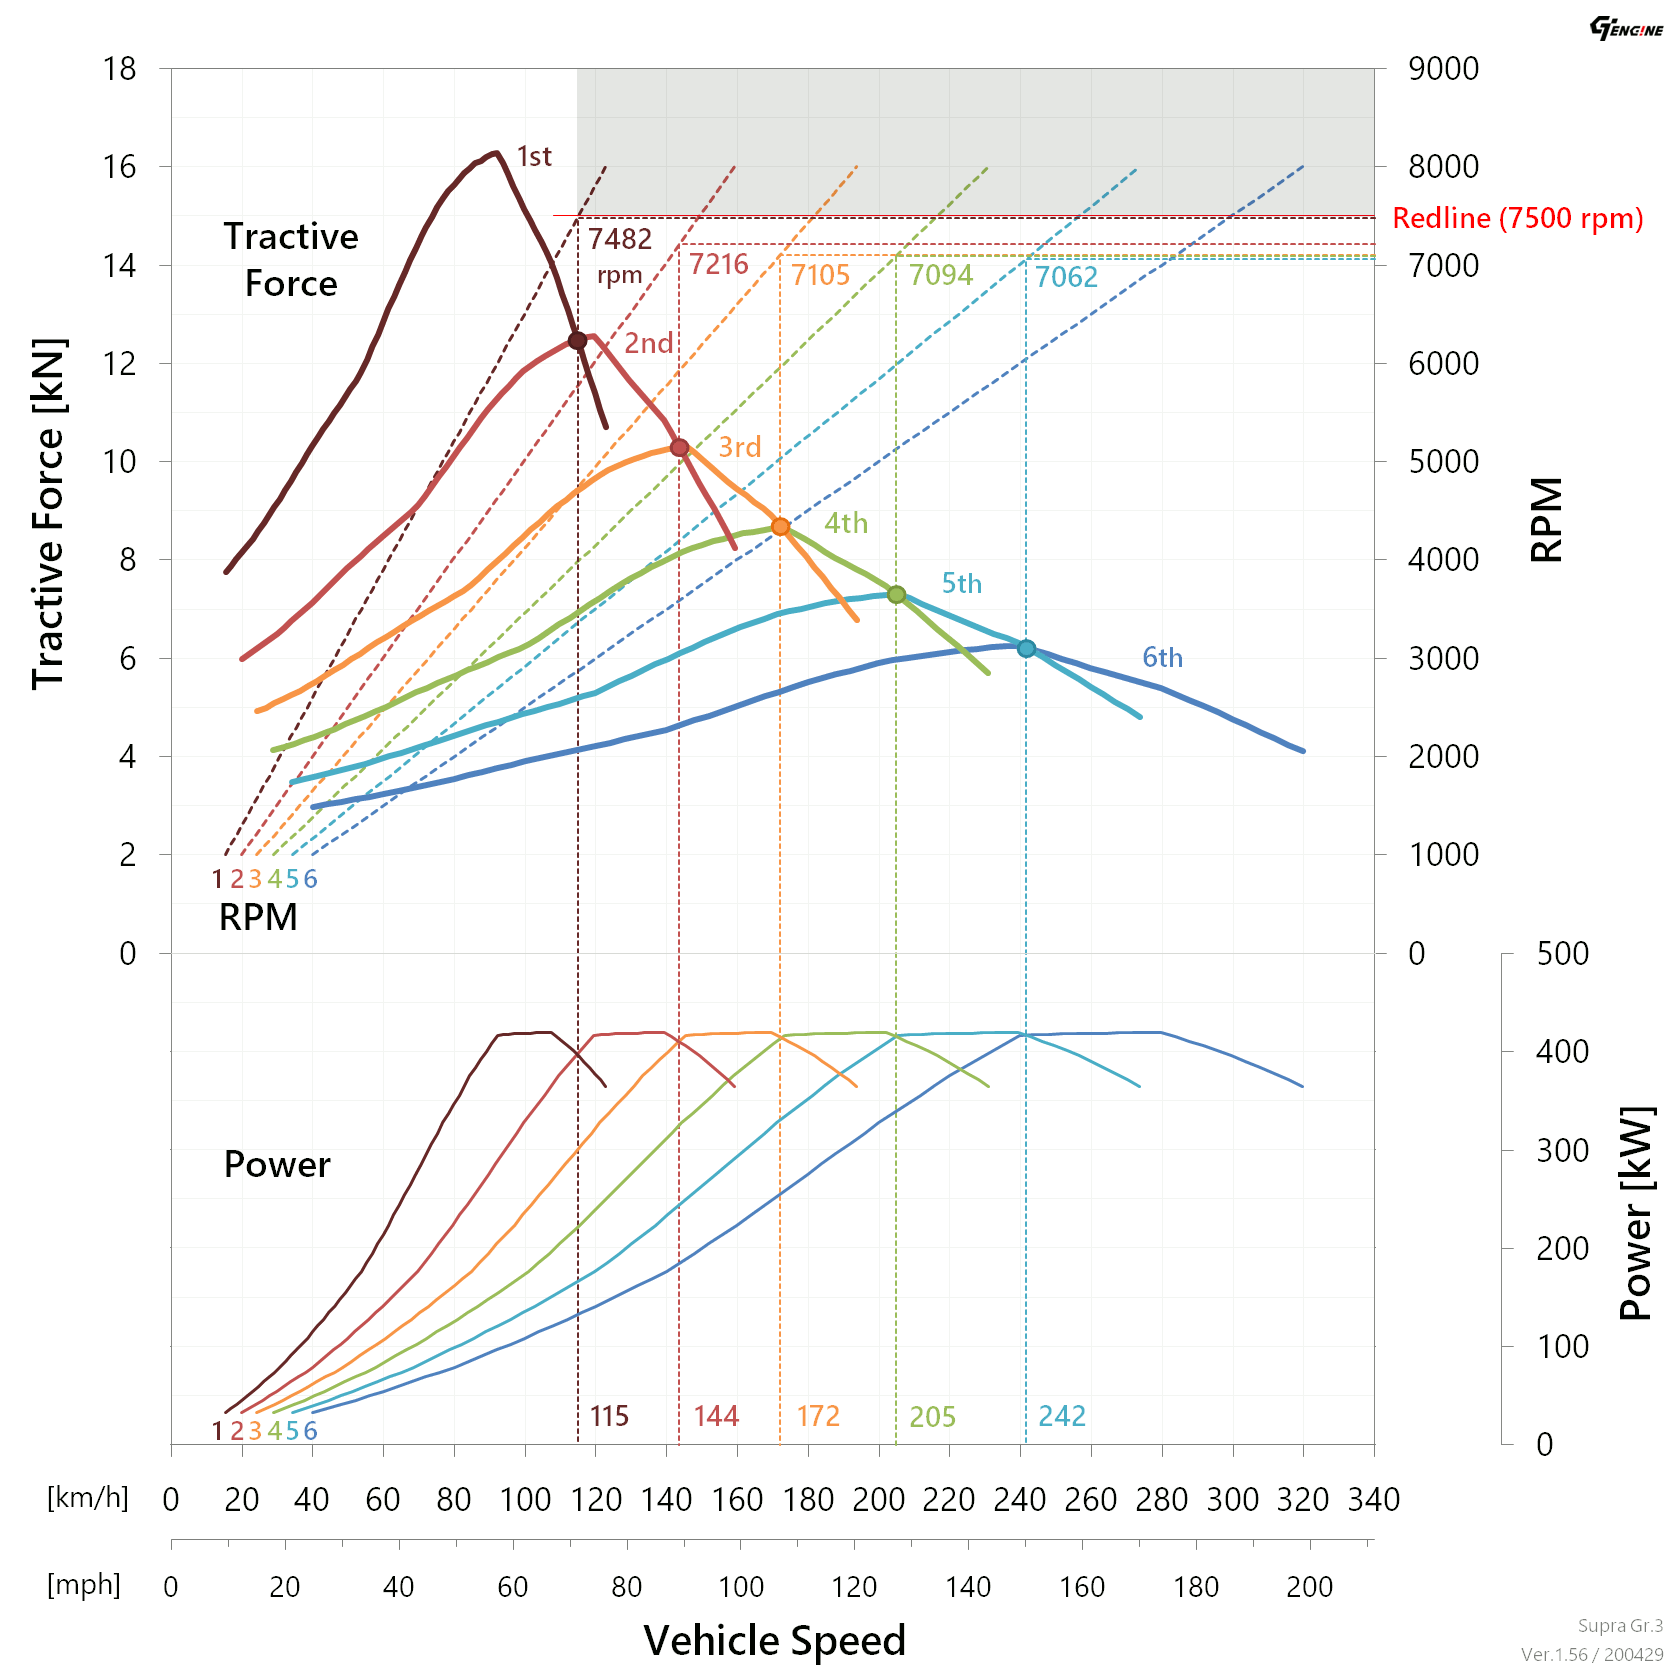
Note that the optimal RPMs are the intersection RPMs in Fig.2 rounded to the nearest hundred.
A basic concept of this calculation method is always keeping maximum tractive force during acceleration. As mentioned in Summary, this method is static and does not include transitional factors. For example, they are changes of drag, changes of tyre slip ratio, changes of tyre radius and power interruptions during shifting. Therefore, it is not as accurate as a method using a more detailed model. However, this method is simple and fewer parameters are required. It seems to be a convenient and effective method in practical use. In the future, I will also show optimal upshift RPMs of other cars besides the test car.
| Table 2 | Basic Specs of Test Car (BoP Ver.1.56 / 2020-02-27) |
| Car | : | Toyota / GR Supra Racing Concept '18 |
| Category | : | Gr.3 |
| Power Ratio | : | 95% |
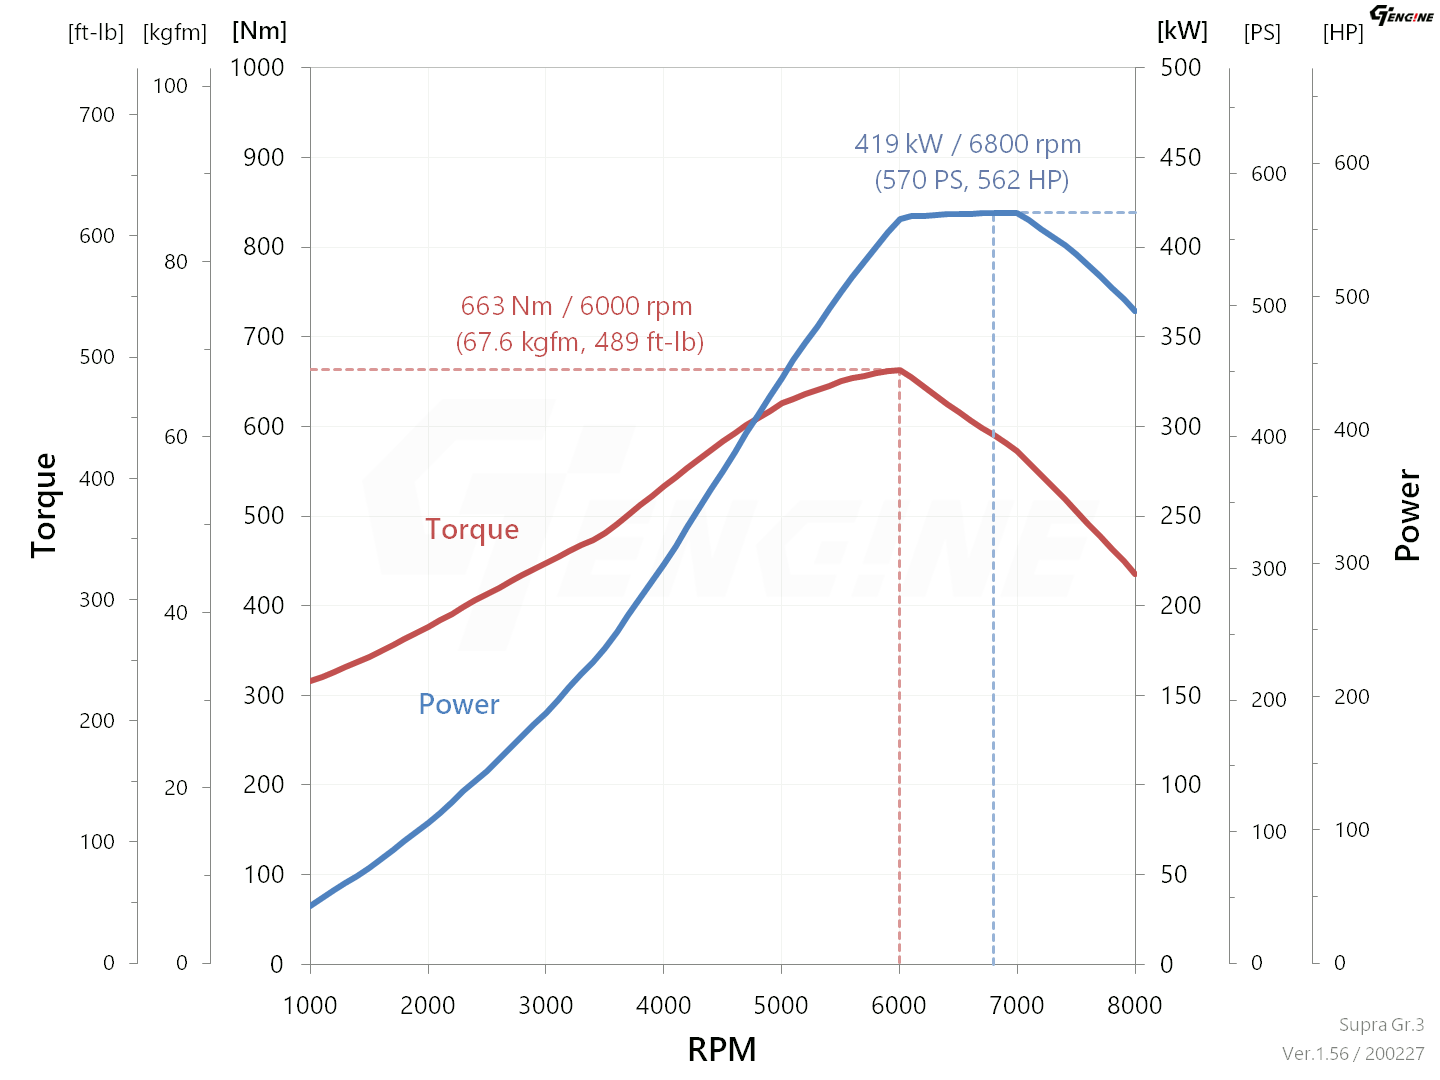
| Max. Power | : | 419 kW / 6,800 rpm (570 PS, 562 HP) |
| Max. Torque | : | 663 Nm / 6,000 rpm (67.6 kgfm, 489 ft-lb) |
| Wt. Reduction Ratio | : | 104% |
| Weight | : | 1,292 kg (2,848 lbs.) |
| Drivetrain | : | FR |
| Aspiration | : | TB |
| Engine Redline | : | 7,500 rpm |
| Max. Engine Speed | : | 8,000 rpm |
| Tyre Diameter | : | 648 mm (Calculated Value) |
| Fig. 3 | Engine Power and Torque Curves |
| Table 3 | Transmission Gear Ratio (Values of "Setting Disable") |
| Gear | Gear Ratio | Top Speed [km/h (mph)] |
|||
|---|---|---|---|---|---|
| Redline | Max. | ||||
| 1st | 2.276 | 115 (71) | – | ||
| 2nd | 1.755 | 149 (93) | – | ||
| 3rd | 1.442 | 182 (113) | – | ||
| 4th | 1.210 | 216 (134) | – | ||
| 5th | 1.021 | 257 (160) | – | ||
| 6th | 0.874 | 300 (186) | 320 (199) | ||
| Final | 3.500 | ||||
Vehicle Speed Measurement
The vehicle speeds of the test car with the optimal upshift pattern and the redline one were measured. Table 4 shows the RPMs of each upshift pattern. Measurement conditions are shown in Table 5.
| Table 4 | Optimal and Redline Upshift RPMs |
| Upshift | Upshift RPM | |
|---|---|---|
| Optimal [rpm] |
Redline [rpm] |
|
| 1st → 2nd | 7500 | 7500 |
| 2nd → 3rd | 7200 | 7500 |
| 3rd → 4th | 7100 | 7500 |
| 4th → 5th | 7100 | 7500 |
| 5th → 6th | 7100 | 7500 |
| Table 5 | Measurement Conditions |
| App. Ver. | : | 1.56 (2020-02-27) |
| Track | : | Special Stage Route X / Back Straight |
| Time | : | 15:20 / Fine Weather |
| BoP | : | Apply* (*Set the same values as "for Road Course" manually) |
| Setting | : | Disable |
| Tyres | : | Racing Hard |
| Tyre Wear | : | OFF |
| Fuel Consumption | : | OFF |
| TCS | : | OFF |
| Transmission | : | MT |
| Controller | : | DUALSHOCK 4 |
| Starting Point Condition | : | 70 km/h (43mph) / 1st gear / Throttle 100% |
| Distance | : | 5,000 m |
| Sampling Time | : | 0.033 s (29.97 fps) |
The vehicle speed was read from the digital speedometer on the display screen and filtered by moving average. Each RPM pattern was measured five times and averaged. Then, a travel distance was calculated from numerical integration of the vehicle speed. The time gap between two upshift patterns was calculated from the vehicle speed and the travel distance. The redline upshift was a reference for the time gap. The origin of time was set at the point of 70 km/h (43mph, 1st gear, throttle 100%).
The vehicle speeds and the time gaps (Fig. 1) are shown again with its enlarged view (Fig. 4).
The maximum speed of the test car was 289 km/h (180 mph) in this condition. The time gap between the optimal upshift and the redline one was -0.064 ± 0.012 seconds at the maximum speed. Measurement errors will be described at the end of this section.
| Fig. 1 | (Shown again) Measured Vehicle Speeds and Time Gaps between Optimal Upshift and Redline Upshift |
| Fig. 4 | Enlarged view from 0 to 16 seconds in Fig. 1 |
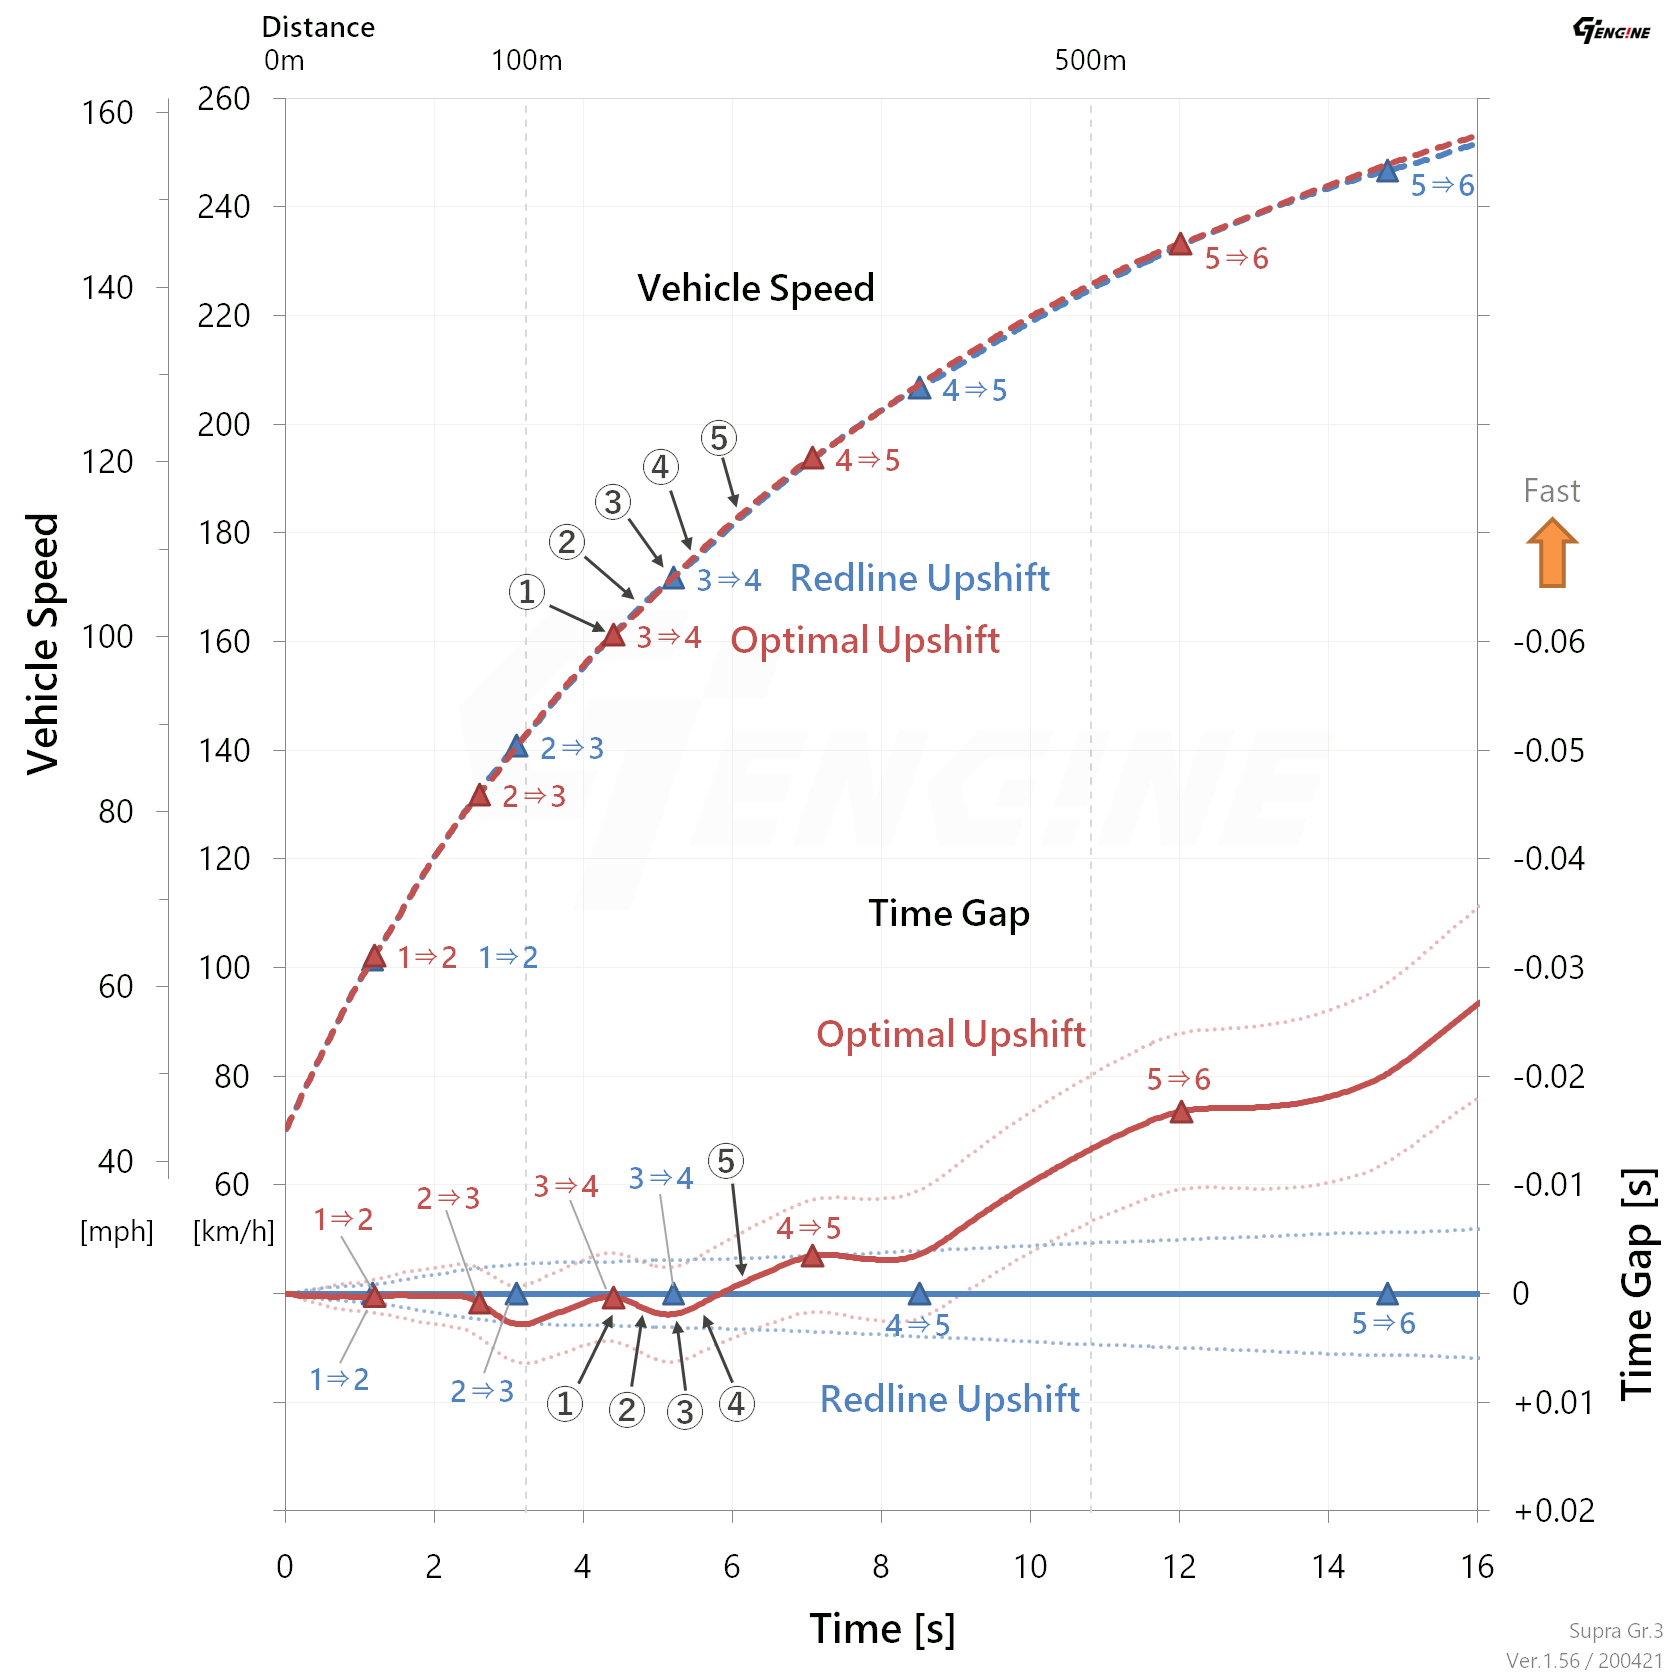
Changes of the time gap will be explained using the 3rd to 4th upshift in Fig. 4 as an example.
① (in Fig. 4) First, the optimal pattern shifts at 7100 rpm. During upshifting, acceleration goes to zero (strictly speaking, negative) for about 0.05 to 0.1 seconds due to interruption of engine power delivery. Therefore, the optimal pattern temporarily falls behind the redline one.
② After the shift, the tractive force of the optimal pattern is larger than the redline one. As a result, the acceleration of the optimal pattern is also larger than the redline one. However, the time gap still keeps increasing while the vehicle speed of the optimal pattern is lower than the redline one.
③ After the redline pattern shifts, both speeds are reversed.
④ Then, the time gap begins to decrease.
⑤ Finally, the optimal pattern overtakes the redline one.
However, regarding the 2nd to 3rd upshift, the next upshift (3rd to 4th) came before overtaking. As a result, there was little gap between the optimal pattern and redline one. This result also suggests that this optimal upshift pattern has room for improvement.
Finally, errors in this measurement will be briefly mentioned. All measurement errors in this test were assumed to be random errors. As mentioned above, the time gap between the two upshift patterns at the maximum speed was -0.064 ± 0.012 seconds. The time gap is a mean of 5 trials. The error of ± 0.012 is twice a standard error (standard error of the mean). The standard error $ \sigma_{\bar{x\rule{0pt}{1.3ex}{}}} $ was given by $ \sigma_{\bar{x\rule{0pt}{1.3ex}{}}} = s_t / \sqrt{N} $, where $ s_t $ is a sample standard deviation of the time gap at time $ t $, $ N $ is the number of trials. The ±$ 2\sigma_{\bar{x\rule{0pt}{1.3ex}{}}} $ shows a 95.4% confidence interval.
Main factors of the measurement error seem to be errors of vehicle speed measurement and dispersion of the upshift RPM due to driver input. I am considering more detailed error analysis and improvement of measurement accuracy.
Conclusion
The theoretical optimal upshift RPMs were calculated from the intersections of the tractive force curves. The vehicle speed of the optimal upshift pattern was measured in actual, and it was confirmed to be superior to the redline upshift pattern. However, this optimal RPM pattern seems to have room for improvement more. I am considering improving the optimal upshift pattern.